Frame rate counters in Windows Phone
July 26, 2010
While developing Windows Phone applications, it’s good to have some simple but important performance tips and tricks in your back pocket. Here’s a quick reference to enabling frame rate counters plus an overview of what the values represent.
Enable frame rate counters in code
In your App.xaml.cs or MainPage.xaml.cs, in the constructor, set the host property to true for this diagnostic mode:
Application.Current.Host.Settings.EnableFrameRateCounter = true;
Make sure the System Tray is not visible
By default in the beta tools, the MainPage.xaml sets the system tray to be visible. When this happens, the frame rate counters are hidden by the operating system shell.
Method 1: XAML
The default page template includes an XMLNS declaration for “shell”, and has this in the phone application page constructor:
shell:SystemTray.IsVisible="true"
Just change the IsVisible property to False:
shell:SystemTray.IsVisible="false"
Method 2: Code
Microsoft.Phone.Shell.SystemTray.IsVisible = false;
In a future release of the phone tools, this is actually going to be less of an issue, as the counters will actually be right-aligned on the screen instead.
Adding a simple check box to toggle the counters
A lot of app developers add a check box to debug builds that lets them toggle this sort of diagnostic display. In one of our ‘Scenarios’ test applications, we have a check box on the first page, and in XAML it connects the Checked and Unchecked events to this method.:
private void FrameRateCounters_Checked(object sender, RoutedEventArgs e)

{

    var checkbox = (CheckBox)sender;

    var newValue = checkbox.IsChecked.GetValueOrDefault();


    Application.Current.Host.Settings.EnableFrameRateCounter = newValue;

    SystemTray.IsVisible = !newValue; // Hides frame rate counter otherwise

}
Enabling frame rate counters only on debug builds
You can also use conditional compilation to just have your debug builds display this information. Add this to your App.xaml.cs:
#if DEBUG

    Application.Current.Host.Settings.EnableFrameRateCounter = true;

    Microsoft.Phone.Shell.SystemTray.IsVisible = false;

#endif
This assumes you remember to eventually ship your app on the marketplace with a release build ![]() .
.
Accelerated graphics note: If you still don’t see a frame rate counter
The frame rate counter only appears when your system has a supported DirectX 10 graphics card that allows the Windows Phone emulator to use accelerated graphics.
If you set the frame rate counter visibility to True, the system tray is hidden, and you still don’t’ see the counters, then unfortunately your system does not have a supported card for displaying this information.
All Windows Phone devices will show the frame rate counter, so once phone hardware is more widely available, you’ll still have an option to test the performance of your apps.
Exploring the frame rate counter data
This has been covered countless times, but I figure if you’re [using your search engine of choice to find this] here that it doesn’t hurt to duplicate.

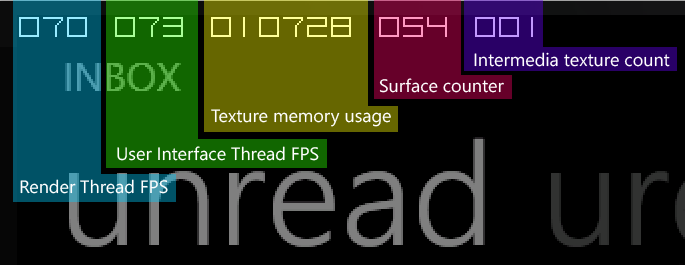
The Beta tools display frame counter information on the top of the page.

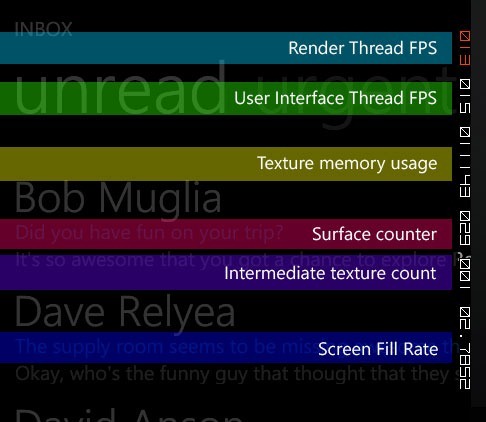
Shipping frame counter information is displayed on the right of the screen.
So moving through the counters, we have the following.
Render Thread FPS: The number of frames per second that the independent simple animations and rendering thread is using. Keeping around 60 will provide a great experience, while a number of 30 fps will begin to show a poor experience to the end user.
Under 30 fps this counter will turn red in post-beta builds.
User Interface Thread FPS: The number of fps that the primary user interface thread is experiencing. Property change notifications, data binding, primary managed code execution, and animations not handled on the render thread use this threads’ resources.
Turns red when the count is at or below 15 fps.
Texture Memory Usage: A specialized memory counter indicating the video memory used for storing application textures.
Surface Counter: A count of the number of surfaces that are passed to the graphics chip.
Intermediate Texture Count: The number of intermediate textures created for compositing.
Screen Fill Rate: A metric representing the number of complete phone screens being painted each and every frame.
This counter was not present in the Beta tools and is a new metric for post-Beta use.
Target frame rates for good performance
When testing on a Windows Phone device, here are key performance metrics to try for. Understand that the emulator (XDE) performance may not be indicative of actual device performance.
Frame rate counters may be 0 when there is no animation being updated on the thread at any particular moment. You can add a very simple, continually animating and repeating, animation to your application during development & testing if you want to ensure that there is always some frame rate value available.
| Counter | Ideal Minimum | Best Experience | Theoretical Max |
| Render Thread | 30 fps | 60 fps | 120 fps |
| UI Thread | 15 fps | > 15 fps | 120 fps |
| Screen Fill Rate | 1.0 | <= 2.0 | N/A |
Future posts will cover tips for improving the frame rate and application performance. Hope this helps.